The Registered Voter Economic Confidence Index (RVECI) is conducted by BIG DATA POLL for the Public Polling Project. It includes interviews from at least 2,000 registered voters nationwide. The sampling error ranges from a low of ± 1.7% to a high of ± 2.1% at a 95% confidence level.
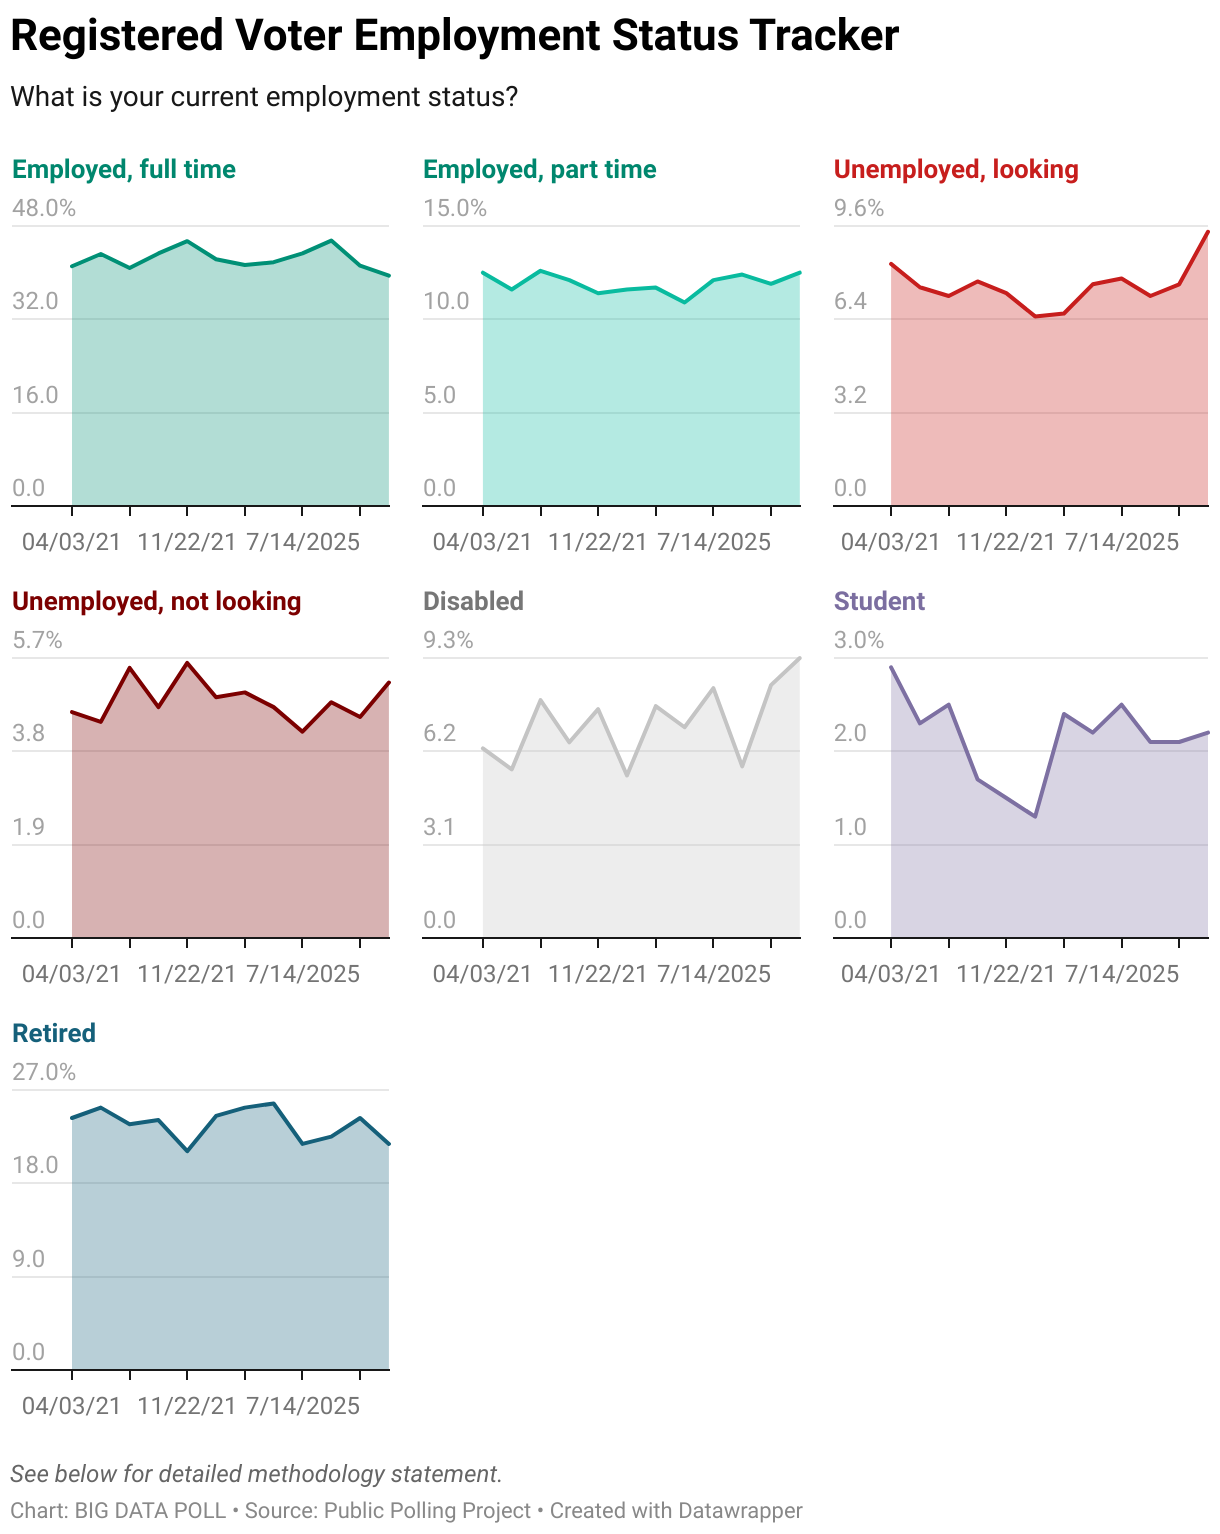
- Views on Current Business Conditions: Views on current/present business conditions.
- Views on Current Employment Conditions: Views on current/present employment conditions.
- Expectations for Business Conditions: Expectations regarding business conditions six months from now.
- Expectations for Employment Conditions: Expectations regarding employment conditions six months from now.
- Expectations for Total Family Income: Expectations regarding total family income six months from now.

Registered Voter Economic Confidence Index Methodology
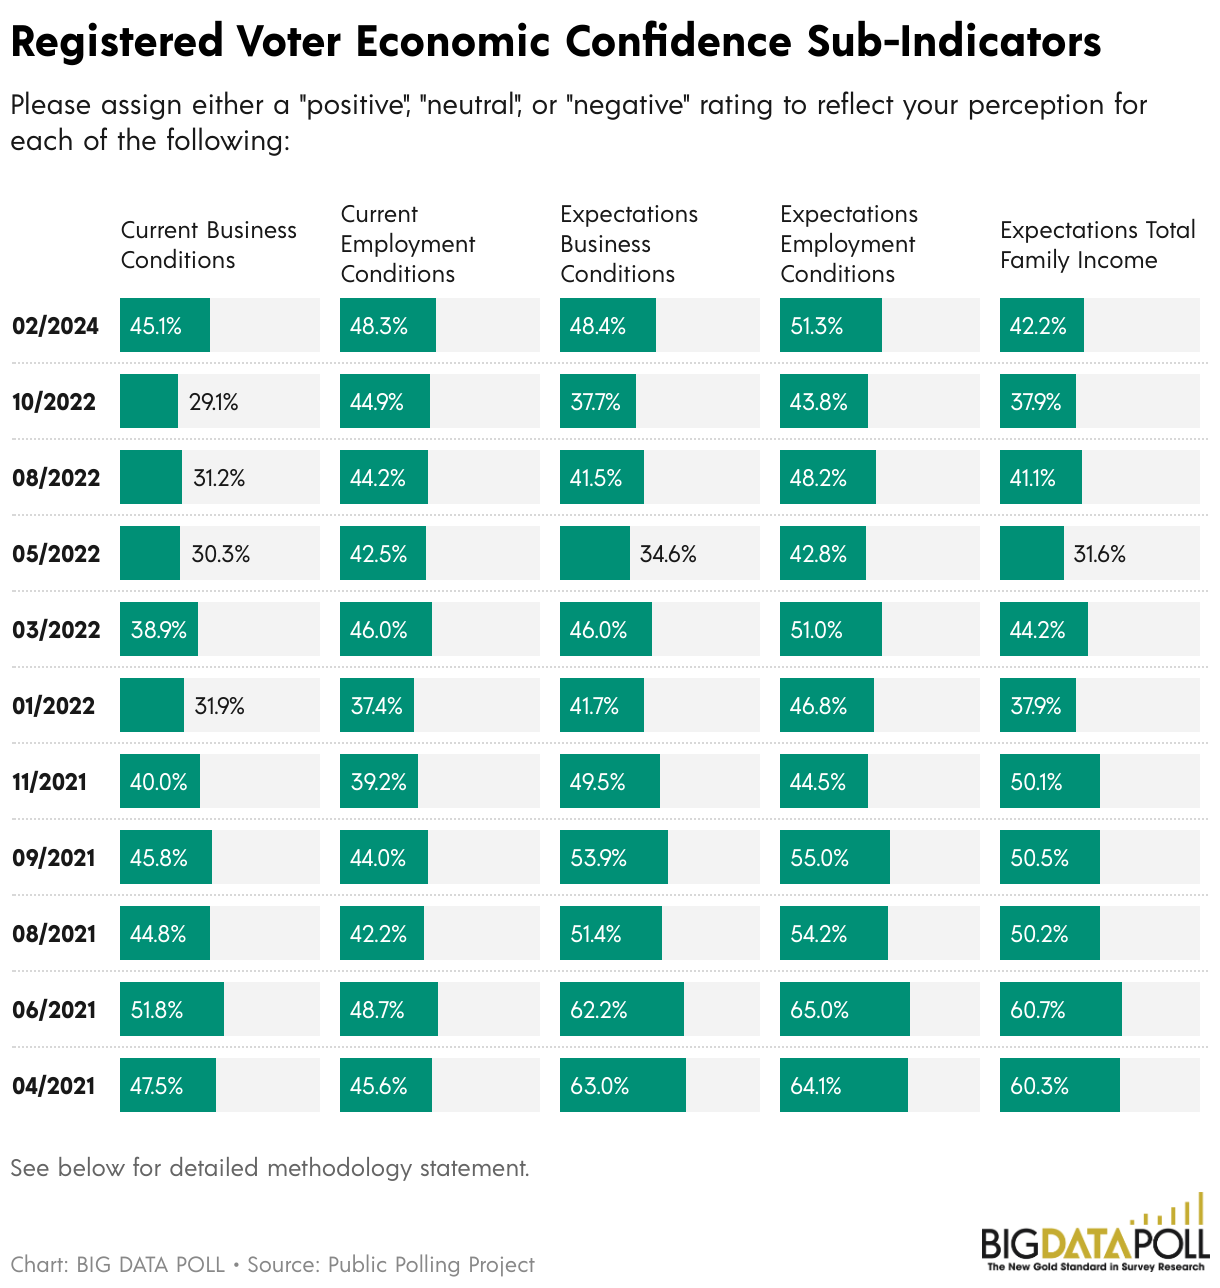
Voters are asked to assign either a “positive”, “neutral”, or “negative” rating to reflect their perception for each of the five sub-indicators detailed below. Each sub-indicator level is calculated as a relative value by dividing the positive percentage by the sum of the positive and negative percentages.
For instance, here is “Current Business Conditions” for the index measured in August, 2021.
Twenty-five percent (25%) said they had a “positive” view of current business conditions and 30.8% said they had a “negative” view. So, let’s do the math.
25 / 55.8 (25+30.8) = .448
That just means 44.8%. Get it?
Let’s also do the math for “Current Employment Conditions”. This month, 28.7% said they had a positive view and 39.3% indicated they had a “negative” view. Again, let’s do the math.
28.7 / 68 (28.7+39.3) = .422
That is 42.2%.
After we have all five sub-indicator levels, we can calculate the two subindex levels and ultimately the main index level.
Sub-Indicator Levels
Current Business Conditions: 44.8
Current Employment Conditions: 42.2
Expectations Business Conditions: 51.4
Expectations Employment Conditions: 54.2
Expectations Total Family Income: 50.2
The Present Situation Index is the average of the first two sub-indicator levels that measure current sentiment. We did the prerequisite math above. The Expectations Index is the average of the last three sub-indicator levels that measure the six-month outlook.
Remember “Order of Operations” in school? How about PEMDAS, or “Please Excuse My Dear Aunt Sally”?
1 – Parentheses
2 – Exponents and Roots
3 – Multiplication
4 – Division
5 – Addition
6 – Subtraction
We first deal with the parentheses before dividing to calculate each subindex level.
Present Situation Index (RED DASH)
(44.8 + 42.2) ÷ 2 = 43.5
Expectations Index (BLUE DASH)
(51.4 + 54.2 + 50.2) ÷ 3 = 51.9
Registered Voter Economic Confidence Index (GOLD SOLID)
(44.8 + 42.2 + 51.4 + 54.2 + 50.2) ÷ 5 = 48.6
Methodology
The Public Polling Project conducted by BIG DATA POLL interviews no less than 2,000 registered voters nationwide and is a mixed mode survey. Interviews conducted online are sourced through Lucid (CINT) and live-agent phone interviews including P2P SMS and text-to-online are sourced from L2 or the Aristotle National Voter File Database. Participants who opt for text-to-online are given 24 hours to complete the interview. Results are weighted for sex, age, race and ethnicity, education, and geography. The overall sampling error ranges from a low of ±1.7% to a high ±2.1% sample (n) depending at a 95% confidence level. It is important to note that sampling errors for subgroups are higher.
All BIG DATA POLL publicly conducted surveys are crowdfunded via the Public Polling Project, supplemented if necessary by BIG DATA POLL and are NOT funded by or affiliated with any candidate, campaign, committee, or political entity. Interactive crosstabs are available on MarketSight with each corresponding press release.